Author
Luana Pereira
Date
October 9, 2026
Category
Guides
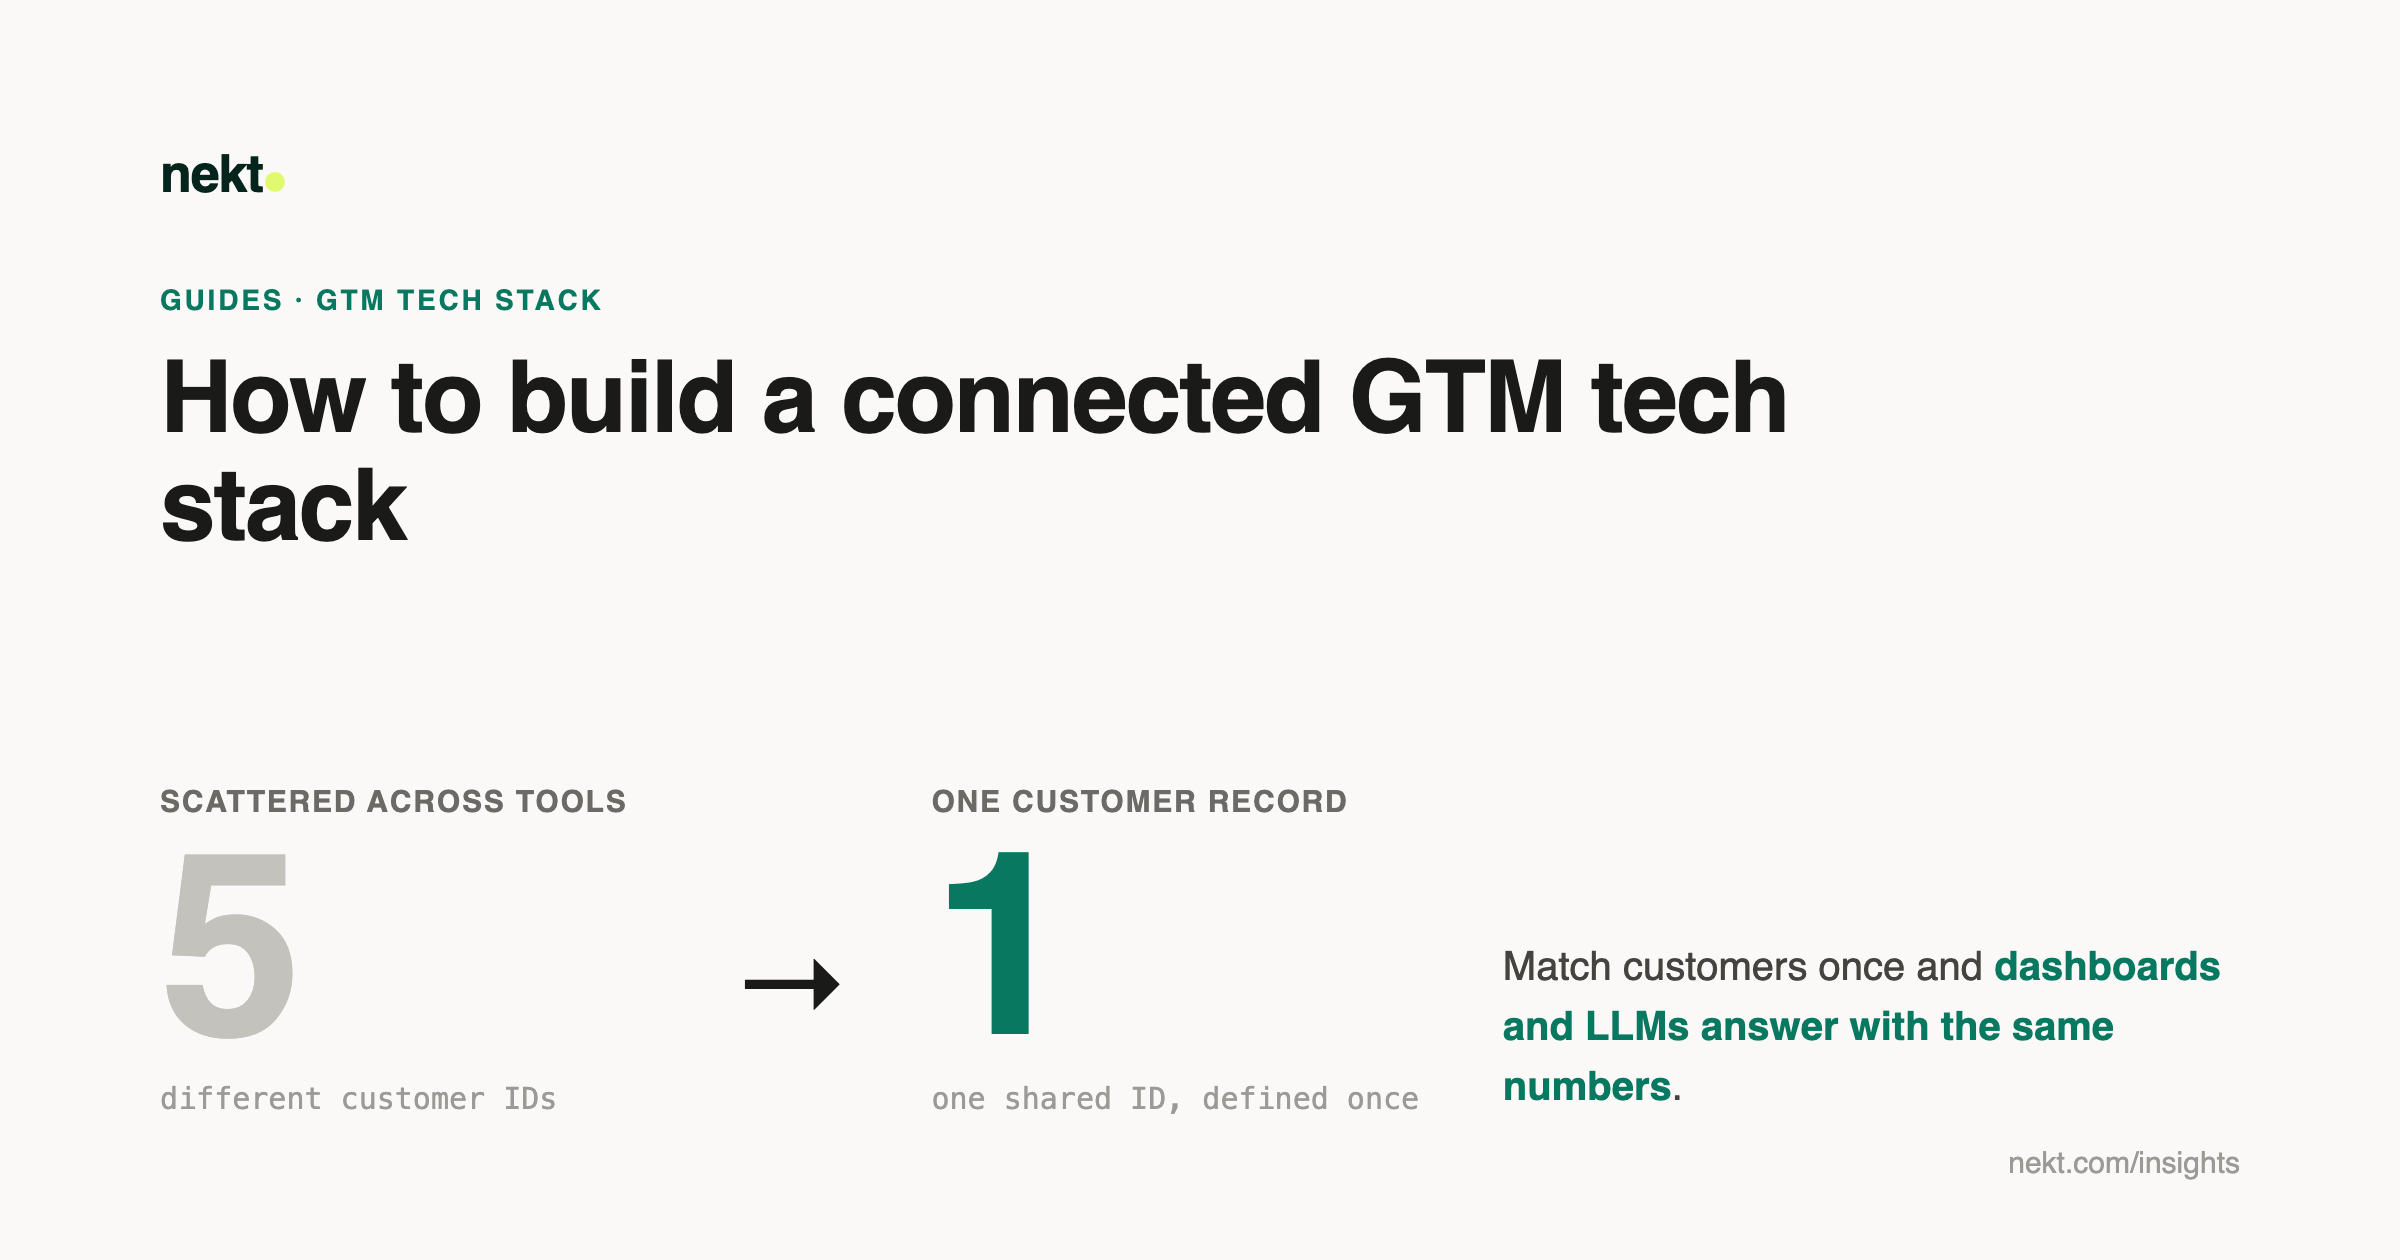
A connected GTM tech stack gives records from your CRM, billing, product and support tools a shared home and a common set of definitions, so dashboards and LLMs answer with the same numbers. This guide covers how to build that data layer, how to make it available to dashboards and LLMs, and how Salesforge put the approach into practice.
A customer can visit your website, speak to sales, buy a subscription and open a support ticket within the same week. Each step creates a record in a different tool. When someone asks how much that customer pays, which products they use, or whether they have an unresolved issue, the answer has to be pieced together.
The same problem appears when you want to know which customers downgraded after contacting support, which accounts have paid while their deals remain open, or which acquisition sources bring in customers who stay. Each question needs records from several systems and a consistent way to connect them.
A connected GTM tech stack gives those records a shared home and a common set of definitions. This guide covers how to build that data layer, how to make it available to dashboards and LLMs, and how our customer Salesforge put the approach into practice.
A GTM stack grows around the work each team does. Sales manages deals in a CRM, finance handles subscriptions in a billing platform, and product and support teams track activity in their own systems. Each tool describes a different part of the customer relationship.
Direct integrations can keep specific fields up to date. A billing sync, for example, can mark a CRM account as paying. To understand what happened before a downgrade, though, you also need the subscription history, product activity and support conversations for that account over the same period.
Reports can also disagree because they count different things. If a customer cancels one product and keeps another, a subscription report may show churn while an account report shows contraction. Both views have a purpose, and the distinction needs to be clear wherever those numbers are used. It is the same divergence described in why AI agents give different answers on the same data: without one governed definition, every tool reports its own number.
A shared data layer brings the records together and applies those rules in one place. The prepared tables give teams a consistent way to report on customers and revenue while the source tools continue recording activity.
The data moves through four stages: collection, storage, modeling and access.
| Stage | What happens | Output |
|---|---|---|
| Collection | Connectors pull records from the CRM, billing, product, support and website tools. | Raw source records |
| Storage | Records land in a warehouse or lakehouse close to their original form. | Raw layer tables |
| Modeling | Models clean fields, match customer identities and calculate metrics. | Trusted and Service tables |
| Access | Dashboards, alerts and LLM tools read the prepared tables. | Reports, alerts and answers |
The modeling stage gives those records their business meaning. A customer may have a different ID in each system, and a field called status may describe a deal in one tool and a subscription in another. Define those relationships once so every report and AI query can use them, the discipline of context engineering for AI agents.
The order matters too. A customer health table that depends on billing and support should run after both sources have refreshed, so it does not combine today's payments with yesterday's support activity.
Nekt brings source connections, transformations, destinations and pipeline triggers into one workspace. Its plans include a managed warehouse, and teams that already use BigQuery can connect it as a source or destination.
Choose a question that currently sends someone into several tools or requires a spreadsheet join. For a subscription business, a useful starting point is: what is each customer paying us today across all products?
That gives the first build a clear scope: billing records, a way to group subscriptions by customer, and the CRM information needed to link those customers to accounts. Reconcile the totals against the billing system using the same rules before adding more data.
Add product analytics for activation and usage, support data for customer issues, and website analytics for acquisition questions. Bring each source in when it serves a question you are ready to answer.
Before joining records, decide what counts as a customer. A company, billing account, workspace and individual user can represent different levels of the relationship, and that choice determines what belongs in each row of the customer table.
Map the identifiers each system uses: a CRM company ID, a billing customer ID, product workspace IDs, and the email addresses attached to support conversations. A mapping table connects those identifiers to the shared customer ID used in your reporting models.
| System | Identifier it uses |
|---|---|
| CRM | Company ID |
| Billing | Customer ID |
| Product | Workspace or account ID |
| Support | Email address on a ticket or conversation |
Use stable identifiers where they are available and review uncertain matches. Email domains can produce incorrect joins when customers use personal addresses or share a domain across business units, and assigning a payment or support issue to the wrong account changes the conclusions drawn from it.
The customer table can hold MRR by product, payment status, activation and renewal dates, account ownership and recent support activity. Keep dated revenue changes and activity in related tables too, since a current snapshot cannot show what happened before a downgrade last quarter.
A shared customer ID handles matching, but teams still need to agree on metric definitions. A cancellation request, the end of a paid subscription and the loss of all revenue from an account can happen on different dates, and your churn calculation needs to say which event it uses. Before publishing a churn report, agree on three rules:
Apply the same approach to MRR, activation and retention. Give subscription churn and customer churn separate names and calculations, and document the dates, fields and exclusions each metric uses. Writing those rules down before the code is a data contract. A customer health table also needs an explanation of what healthy means: Nekt's semantic layer holds context documents that give agents the relevant business definitions before they write a query.
An LLM retrieving records from several apps still needs rules for joining them and interpreting the fields. Without a shared model, each conversation may have to decide which accounts match, which dates to use and how to calculate churn.
Prepared tables put those decisions somewhere the team can inspect and test. An agent answering a question about downgrades can use the same customer mapping, revenue changes and support history as the company's reports. MCP, or Model Context Protocol, is one way to give a client such as Claude access to that data: Nekt's MCP Gateway connects agents to its data and platform tools, with the semantic layer providing business context.
Limit each agent's access to the data and actions it needs. Check the calculation, period and records behind important answers, using the shared model to trace how the result was produced.
After the first tables are running, keep checking their freshness and assumptions.
Start with how quickly the decision behind each table could change. A daily refresh may be enough for a monthly board metric, while account-risk alerts may need several updates throughout the day. Schedule sources and transformations together: running a health model more often will not make its support data fresher if that source updates once a day, and models with several inputs should wait for all required upstream runs.
Check what a field actually records before using it. A first-payment date should stay consistent after payment failures or subscription changes if you use it for customer tenure; if it does not, derive the first successful payment from the payment history. Compare health signals with the outcomes they are meant to describe, and if a model measures payment status, its name should make that scope clear to the people reading it.
Track pipeline failures, table freshness and unexpected changes in row counts. Give someone ownership of the alerts so a failed refresh gets investigated while the dashboard is still showing its last successful result.
Salesforge sells several outbound sales products, and many customers sign up and pay by card without speaking to sales. Its customer information sits across these sources:
| Source | Role in the stack |
|---|---|
| Chargebee | Billing: subscriptions and payments |
| Mixpanel | Product analytics: activity and activation events |
| HubSpot | CRM: companies, deals and meetings |
| Gleap and Jira | Support: conversations and tickets |
| GA4 | Website analytics: visits and acquisition sources |
Before May 2026, questions that crossed these systems required exports and spreadsheet joins, and teams could report different MRR totals on the same day.
Salesforge signed with Nekt on May 12, 2026. It wanted a BigQuery-connected setup without maintaining ingestion infrastructure, and a way for RevOps to build through Claude Code and the Nekt MCP server. Nekt's pricing also suited the setup: each source, transformation or destination run uses one credit, and failed runs consume none. Engineering signed off after reviewing Nekt's SOC 2 Type II report, issued on May 25, 2026.
One RevOps builder completed the first customer table on May 30, 18 days after Salesforge signed with Nekt, without a dedicated data team. It held one record per customer, including MRR by product, customer status, activation dates and renewal dates. The builder reconciled total MRR against Chargebee before using the table for further reporting, which gave the team a checked starting point for the models that followed.
A completed Chargebee sync triggers the customer journey model, followed by the MRR changelog and customer health calculations, and models with several inputs wait for all required upstream pipelines. The main sequence runs four times a day and takes about 30 minutes. One definitions file generates the semantic layer's context documents, and the Service tables feed Forge Control, Salesforge's revenue and retention dashboard, Slack alerts, and an internal question box connected through the Nekt MCP, so plain-English questions and dashboard reports use the same prepared data.
The main sequence initially ran eight times a day and consumed about 246 credits daily. Salesforge reduced the main source runs to four and moved slower-changing tables to a daily schedule.
| Setting | Before | After |
|---|---|---|
| Main source runs | Eight per day | Four per day |
| MRR waterfall and unit economics | Ran with the main sequence | Ran once per day |
| Daily credit use | About 246 credits | Roughly half the previous amount |
The team also found that usage signals had not predicted churn in its analysis. It clarified that the customer health status reflected billing status, giving people a more accurate description of what the model measured.
Use one business question to guide the first build:
The first milestone is a number your team can explain and trace back to its source records. From there, the next question can build on the customer mapping and definitions already in place.
A GTM tech stack is the set of tools a business uses to attract, sell to and retain customers. A connected data setup brings their records together so teams can report on the same customers using agreed definitions.
Salesforge built its first table without one. Managed storage and connectors reduce the infrastructure work, but someone still needs to own customer matching, definitions, validation and maintenance.
It depends on the sources, record quality and customer matching work. Salesforge shipped its first table 18 days after signing with Nekt. Start with one question to keep the initial scope manageable.
Match the schedule to the decision. Monthly reporting may need a daily refresh, while account-risk alerts may need several updates a day. The table's freshness also depends on its source schedules.
Prepared tables and written definitions give an LLM a clear basis for answering. Check that it used the right period, customer level and calculation, tracing the result through the shared model.
Connect your billing and CRM data, build the table around one business question, and check the result against your source records. See how Nekt works, or create a free account and connect your first source.